Instagram Users by Country: 30 Markets Compared
The Numbers in Context
India leads the country comparison, with an estimated 481 million Instagram advertising users in late 2025. Worldwide, Instagram reached three billion monthly active users in September 2025, according to Meta. Those figures measure different things: the country table below compares potential advertising audiences, not verified counts of everyone who uses Instagram.
If you are choosing a market, planning content or checking how widely Instagram is used where you live, the country total is a useful starting point. It becomes much more useful when you can see the date, the population share and what “users” means in the dataset.
This guide compares 30 countries and markets using one reporting period. It also shows how to read the figures without confusing a large national audience with the audience your own account can reach.
Aumenta il coinvolgimento sui tuoi post.
"Mi piace" reali su Instagram che indicano valore sia all'algoritmo che ai tuoi follower.
Instagram users by country: the comparison table
Data period: late 2025. The figures come from Meta’s advertising tools, as reported in DataReportal’s Digital 2026 country reports. The report year is 2026, but the underlying country estimates are from late 2025. They are not live September 2026 counts.
The table is ordered by estimated advertising audience among the 30 markets covered, not presented as an exhaustive world ranking. Each country name opens its underlying report; “reach versus population” uses the total population, including people outside Instagram’s eligible age range.
| Country or market | Estimated ad audience (millions) | Ad reach vs total population |
| India | 481 | 32.8% |
| Stati Uniti | 182 | 52.3% |
| Brasile | 147 | 69.0% |
| Indonesia | 108 | 37.6% |
| Giappone | 63.2 | 51.4% |
| Turchia | 62.3 | 70.9% |
| Messico | 53.6 | 40.5% |
| United Kingdom | 35.5 | 50.9% |
| Germany | 31.3 | 37.2% |
| Argentina | 31.1 | 67.7% |
| Italia | 29.9 | 50.5% |
| Francia | 28.2 | 42.2% |
| Filippine | 26.9 | 22.9% |
| Spain | 26.4 | 55.0% |
| Corea del Sud | 25.6 | 49.5% |
| Pakistan | 22.4 | 8.7% |
| Egitto | 21.7 | 18.2% |
| Canada | 21.0 | 52.2% |
| Thailand | 20.6 | 28.7% |
| Australia | 15.2 | 56.0% |
| Kazakhstan | 13.1 | 62.7% |
| Ucraina | 12.6 | 32.0% |
| Taiwan | 12.2 | 52.6% |
| Country or market | Estimated ad audience (millions) | Ad reach vs total population |
| Vietnam | 11.7 | 11.4% |
| Nigeria | 10.0 | 4.2% |
| South Africa | 8.60 | 13.2% |
| Romania | 6.00 | 31.8% |
| Belgio | 5.10 | 43.4% |
| Grecia | 4.60 | 46.3% |
| Singapore | 3.35 | 57.0% |
Read the audience column as a rounded estimate of potential advertising reach. Do not read the final column as a census showing the exact percentage of individual residents who use Instagram: the numerator is an advertising estimate, while the denominator is a population estimate.
Which country has the most Instagram users?
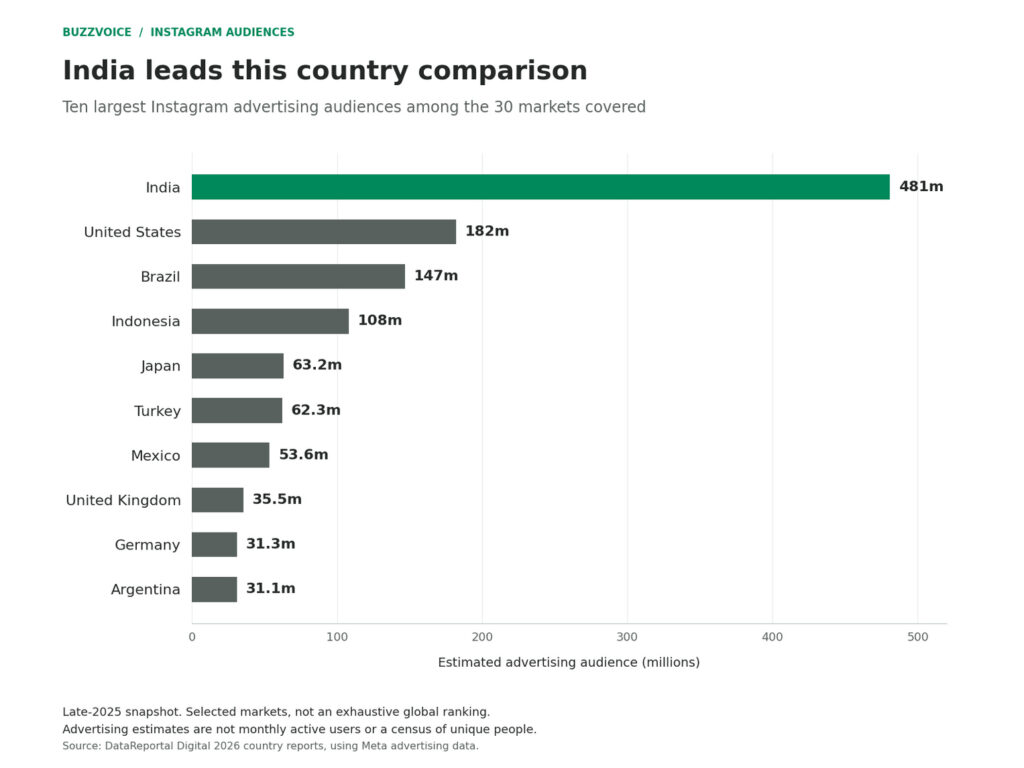
India is comfortably the largest audience in this comparison. Using the rounded country figures above, its estimated advertising audience is about 2.6 times the US figure and more than three times Brazil’s. That describes the scale of the advertising market, not a guarantee that a post can reach those accounts.
There is also a newer data point: DataReportal’s April 2026 update reports more than 513 million users in Instagram’s reported reach for India. I have not substituted that figure into the table because doing so would compare India in a later period with other countries in late 2025.
For a broad comparison, keep dates aligned. For a campaign you are planning now, treat the table as a benchmark and check the current estimate for the country, age range and other settings you intend to use before allocating a budget.
What the regional picture tells you
The table is more useful than a single global total because the markets differ in both scale and relative reach. The following comparisons use the same late-2025 figures shown above, rather than mixing in older statistics or newer snapshots for selected countries.
The Americas: size and relative reach are different
The United States has the largest advertising audience among the American markets shown, followed by Brazil. Brazil’s reported reach is higher relative to its total population, so “largest audience” and “highest population share” lead to different answers.
Mexico, Argentina and Canada offer additional points of comparison, but they should not be treated as interchangeable markets. For planning, consider the language, delivery area and customer demand you can serve alongside the audience estimate.
Europe: compare the actual market, not a regional average
Among the European countries covered, the UK, Germany, Italy, France and Spain have much larger estimated advertising audiences than Belgium, Greece or Romania. That is a scale comparison, not a reason to rule out a smaller country. A business serving one local market should care more about relevant reach than its position in a worldwide list.
Turkey is a useful reminder to check percentages as well as totals. Its audience is slightly smaller than Japan’s in this snapshot, while its reported reach relative to the total population is considerably higher.
Asia, Africa and Australia: avoid assumptions from population alone
India and Indonesia are the largest Asian audiences in the comparison. Japan, South Korea, the Philippines and Taiwan also show why an “Asia average” would conceal important differences between the countries a creator or advertiser might target.
Egypt, Nigeria and South Africa illustrate a similar point: a country’s total population and its Instagram advertising audience are not the same measure. Singapore and Australia, meanwhile, show how a smaller absolute audience can sit alongside a relatively high population-reach figure. Use both columns before making a shortlist.
Why Instagram ad reach is not the same as active users
The global monthly-active-user milestone and the country advertising estimates should not be added together or treated as interchangeable. They answer different questions, and doing so can make a comparison look more precise than the underlying evidence supports.

| Metrico | What it helps answer | What it does not establish |
| Monthly active users (MAU) | How large is the platform’s active audience over a monthly period? | A directly comparable country breakdown from the advertising tables. |
| Potential advertising audience | What audience does the platform’s advertising system estimate could be addressed? | A census of unique residents or guaranteed campaign delivery. |
| Ad reach versus total population | How large is the advertising estimate relative to the whole population? | The exact share of residents with an account. |
| Your account’s viewers or reach | Which accounts actually saw your content during a selected period? | The audience of the country or platform as a whole. |
DataReportal’s notes on advertising-audience data explain why ad reach can differ substantially from monthly active users. Advertising restrictions, reporting revisions and duplicate or non-human accounts can affect these datasets. Changes in the published estimate do not automatically equal people joining or leaving the platform.
This is also why the country rows should not be summed to recreate Instagram’s global MAU total. The table covers selected markets, and the two datasets do not count the same thing in the same way.
Check the denominator before quoting a percentage
A claim such as “Instagram reaches 90% of a country” is incomplete until you know whether it refers to all residents, adults, eligible users or internet users. Those populations have different sizes, so the same platform can produce very different percentages.
For example, the Digital 2026 report for Turkey gives a late-2025 Instagram advertising-reach equivalent of 70.9% of the total population and 92.1% of adults aged 18 and above. Quoting the second figure as “92.1% of everyone in Turkey” would change what the statistic says.
Keep the denominator attached to the number wherever you reuse it. If you compare population shares between countries, use total population for every country; if you compare adult reach, use the adult measure throughout.
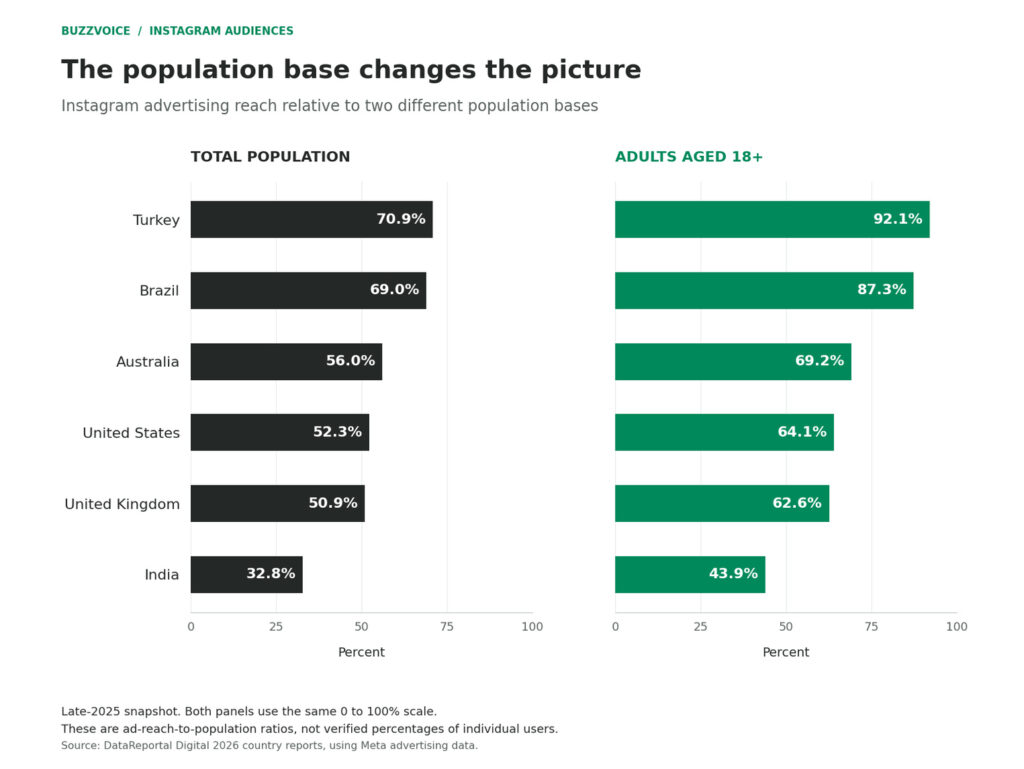
The chart compares total-population reach with adult reach for Turkey, Brazil, Australia, the United States, the United Kingdom and India. Each pair refers to the same country and period but a different population base. Adult reach concerns the adult audience, so the higher percentage is not evidence of audience growth.
Do country audiences have the same gender split?
No. In the late-2025 reports, the adult advertising audience was 69.7% male in India, while the female share was 54.5% in the United States and 57.1% in Brazil. A global generalization would hide those market differences.
These are reported adult advertising-audience categories, not a complete description of everyone using the app. The country reports also warn that their published female and male shares may not add to 100%, so do not fill the gap with an invented demographic category or adjust the figures to force a total.
How to find the countries your own Instagram audience comes from
National figures are useful background, but your account may attract a very different mix of people. Check the location data for the audience you actually reach before deciding that a large national market is the right priority.
Meta’s Instagram Insights guidance describes top-country and top-city breakdowns for viewers and accounts engaged. For viewer demographics, it says to use a preset timeframe and reach over 100 accounts; for engaged-audience demographics, engage over 100 accounts. If seven days does not show enough information, try a longer available preset.
- Open Instagram Insights and choose a reporting period. Start with a longer preset if the shorter window produces too little demographic data.
- Look for the demographic breakdown of viewers or accounts engaged. Read the metric definition so you know whether you are examining people who saw content or people who interacted.
- Note the leading countries and cities. Keep those results separate from follower totals and the national advertising estimates in this article.
- Compare periods of the same length before changing your strategy. A single successful post is a reason to investigate a market, not proof that your whole audience has shifted.
Fai crescere il tuo pubblico su Instagram.
Follower reali e fedeli provenienti da profili autentici. Rafforza la tua credibilità sui social in tutta sicurezza.
Use the country data to make better content decisions
Treat the comparison as a shortlist, not a verdict. A market is useful only if your content, offer and practical limitations fit the people you want to reach there.
Choose relevance before audience size
Start with where your customers can buy, where your service operates and which languages you can support well. An enormous potential audience is not useful if readers cannot use your offer or understand the content.
For example, a local studio should prioritize its service area rather than the country with the biggest Instagram number. A digital product with several language versions can test a wider set of markets, but it still needs evidence from actual responses.
Localize the message, not just the translation
Review references, humour, examples and calls to action for the audience you intend to serve. Use a bank of creative Instagram captions as a starting point, then adapt the wording to the reader and the post instead of publishing the same line everywhere.
Keep tests manageable. Change one meaningful element, such as the language or local example, and judge the response against a clear goal rather than assuming that a national audience total predicts engagement.
Schedule for the audience’s time zone

Use your actual audience locations when testing the best time to post on Instagram. A posting time that is convenient for you may fall in the middle of the night for the readers you want to reach.
If your audience spans several time zones, test more than one publishing window. Keep a record of the local time, content type and result so that a strong post is not mistaken for proof that a particular hour always works.
Measure the response after people see the post
Decide whether the goal is a useful conversation, a profile visit, a website visit or a sale. For website-focused content, tracking Instagram link clicks is a more relevant next step than celebrating the size of the country’s overall Instagram audience.
Judge the market using outcomes you can observe. A smaller audience that responds to your content can be a better fit than a much larger one that does not.
Domande frequenti
Why do different websites show different Instagram country totals?
Often they use different dates, sources or definitions. One page may quote a monthly-active-user milestone, another an advertising estimate, and another an old number beneath a newly updated headline. Check the underlying reporting period and metric before deciding that the figures contradict each other.
Why are Russia and China missing from the table?
I could not verify a comparable current Meta-derived country figure for either market in this dataset. DataReportal’s methodology notes explain that Meta stopped publishing advertising-audience updates for Russia in 2022. An omitted country is not a country with zero Instagram users, and an old figure should not be presented as current.
Does an increase in ad reach mean Instagram gained that many users?
Not necessarily. A change can reflect actual audience activity, a revision to the advertising system’s estimates or changes in how the platform reports its data. Treat it as a change in reported advertising reach unless the source specifically establishes a change in active users.

BuzzVoice
BuzzVoice è il posto migliore dove andare quando si ha bisogno di servizi di engagement immediato sui social media. Offre un'ampia gamma di pacchetti per Instagram, Youtube, Facebook, Twitter, Soundcloud e Tiktok.